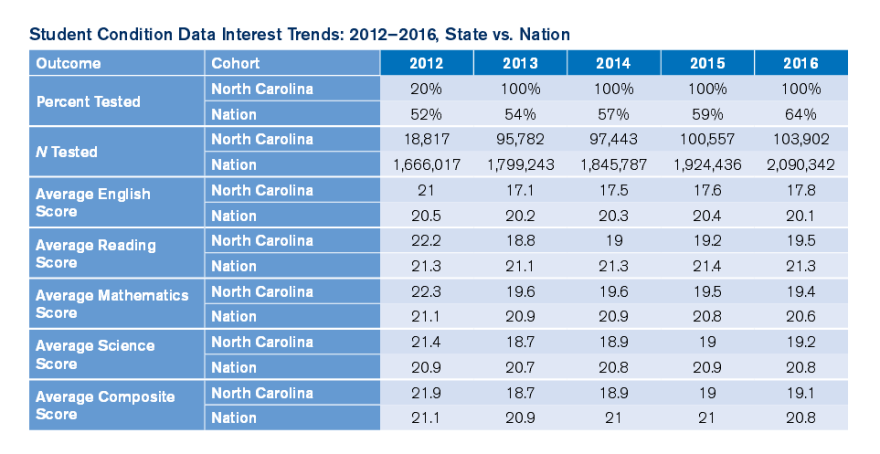
North Carolina's class of 2016 had an average score of 19.1 on the ACT, slightly higher than the class of 2015's average score of 19.0 The average score has increased slowly, but steadily since all students began taking the test in 2013. But it remains below the national average of 20.8. The ACT tests students' readiness for college coursework in four subject areas: English, reading math and science. Most college and university admissions offices use ACT scores to evaluate students' applications. The highest possible score is 36 points.
Tammy Howard, director of the accountability services division of the North Carolina Department of Public Instruction, said as the state helps educators get better at teaching the state's academic standards, ACT scores should increase.
"It's not something that can happen the semester before, or...the semester they're going to take the assessment," she said. "It's a building block system going all the way back to really pre-K."

North Carolina not alone in slow ACT score growth
Since the state began testing all high school juniors in 2013, the percentage of North Carolina high school graduates getting college-ready scores on the ACT has moved one percentage point, from 17 percent to 18 percent. Despite the seemingly low growth figure, Howard said one percentage point is actually pretty good.
"It actually does show that there is improvement," she said. "Having the results that we want overnight is not really what we're about. We're about steady improvement over time and focusing on an end goal down the road. And so we're actually very pleased."
National growth wasn't any faster than North Carolina's for that same three-year period, ticking up from 25 to 26 percent.

The percentage of North Carolina students meeting college-ready benchmarks trails the nation significantly in every subject tested.
Howard said one reason for the discrepancy is that North Carolina tests all juniors, while in many other states, the ACT is optional, so their scores are largely reflective of college-bound students.
Large and Continuing Racial Disparities
The report also shows huge achievement gaps between racial groups. In the class of 2016, almost 50 percent of Asian students and 40 percent of white students got college-ready scores in three or more subjects on the ACT. But for black students, that figure falls to just 8 percent. There are also significant gaps for Latino, Pacific Islander and American Indian students.
Howard said those disparities are on the department's radar.
"A strong priority is to try to identify ways that we can decrease that gap, so yes it is a concern," she said.
The gaps have stayed relatively stable since at least 2012.


